I am new to Angular (even though I am not new to the web development), so please take everything that I am about to say with a grain of salt. That being said, I watched a lot of talks and read a lot of articles relevant to Angular performance, and this post is the summary of my findings.
Please make sure to check out some other posts: My Interview at Uber, 19 Tips For Everyday Git Use, Simple Guide to Finding a JavaScript Memory Leak in Node.js and I Tried To Virtually Stalk Mark Zuckerberg.
Table of Contents
- Minimize/Avoid Watchers
- Avoid ng-repeat. If you have to use ng-repeat use infinite scrolling or pagination
- Use Bind once when possible
- Use $watchCollection instead of $watch (with a 3rd parameter)
- Avoid repeated filters and cache data whenever possible
- Debounce ng-model
- Use ng-if instead of ng-show (but confirm that ng-if is actually better for your case
- Use console.time to benchmark your functions
- Use native JavaScript or Lodash for slow functions
- Use Batarang to benchmark your watchers
- Use Chrome Timeline and Profiler to identify performance bottlenecks
1. Minimize/Avoid Watchers
Usually, if your Angular app is slow, it means that you either have too many watcher, or those watchers are working harder then they should.
Angular uses dirty checking to keep track of all the changes in app. This means it will have to go through every watcher to check if they need to be updated (call the digest cycle). If one of the watcher is relied upon by another watcher, Angular would have to re-run the digest cycle again, to make sure that all of the changes has propagated. It will continue to do so, until all of the watchers have been updated and app has stabilized.
Even though running JavaScript in modern browsers is really fast, in Angular it is fairly easy to add so many watchers that you app will slow down to a crawl.
Keep in mind the following when implementing or refactoring an Angular app.
http://www.codelord.net/2014/06/17/angular-performance-101-slides/
-
Watches are set on:
$scope.$watch-
{{ }}type bindings - Most directives (i.e.
ng-show) - Scope variables
scope: { bar: '='} - Filters
{{ value | myFilter }} ng-repeat
-
Watchers (digest cycle) run on
- User action (
ng-clicketc). Most built in directives will call$scope.applyupon completion which triggers the digest cycle. ng-changeng-model-
$httpevents (so all ajax calls) -
$qpromises resolved $timeout$interval- Manual call to
$scope.applyand$scope.digest
- User action (
2. Avoid ng-repeat. If you have to use ng-repeat use infinite scrolling or pagination
This was the biggest win for our app. I am not going to go into too much details, but I found the article bellow to be extremely helpful.
In addition to infinite scroll, make sure to use track by when possible. https://docs.angularjs.org/api/ng/directive/ngRepeat#tracking-and-duplicates
For example a unique step id, is a good value to track by when doing an ng-repeat.
<li ng-repeat="Task in Tasks track by Task.Id></li>
3. Use Bind once when possible
Angular 1.3 added :: notation to allow one time binding. In summary, Angular will wait for a value to stabilize after it’s first series of digest cycles, and will use that value to render the DOM element. After that, Angular will remove the watcher forgetting about that binding.
https://code.angularjs.org/1.3.15/docs/guide/expression#one-time-binding
<iframe id="cp_embed_QbWJRg" src="http://codepen.io/akras14/embed/QbWJRg?height=268&theme-id=5767&slug-hash=QbWJRg&default-tab=result&user=akras14" scrolling="no" frameborder="0" height="268" allowtransparency="true" allowfullscreen="true" name="CodePen Embed" title="CodePen Embed 1" class="cp_embed_iframe " style="width: 100%; overflow: hidden;"></iframe>
If you are on pre 1.3 version of Angular you can use this library to achieve similar results:
https://github.com/Pasvaz/bindonce
4. Use $watchCollection instead of $watch (with a 3rd parameter)
$watch with only 2 parameters, is fast. However, Angular supports a 3rd parameter to this function, that can look like this: $watch('value', function(){}, true). The third parameter, tells Angular to perform deep checking, meaning to check every property of the object, which could be very expensive.
To address this performance issue, angular added $watchCollection('value', function(){}). $watchColleciton acts almost like $watch with a 3rd parameter, except it only checks the first layer of object’s properties, thus greatly improving the performance.
Official doc:
https://code.angularjs.org/1.3.15/docs/api/ng/type/$rootScope.Scope#$watchCollection
Helpful blog post:
http://www.bennadel.com/blog/2566-scope-watch-vs-watchcollection-in-angularjs.htm
5. Avoid repeated filters and cache data whenever possible
One time binding does not seem to play well with filters. There seems to be work arounds to make it work, but I think it’s cleaner and more intuitive to simply assign the needed value to a variable (or set it as a property on an object, if you are dealing with a lot of variables).
For example, instead of:
{{'DESCRIPTION' | translate }}
You can do:
– In JavaScript $scope.description: $translate.instant('DESCRIPTION')
– In HTML {{::description}}
Or instead of: {{step.time_modified | timeFormatFilter}}
- In JavaScript
<textarea wrap="soft" class="crayon-plain print-no" data-settings="dblclick" readonly="" style="tab-size: 4; font-size: 14px !important; line-height: 20px !important; z-index: 0; opacity: 0; overflow: hidden;">var timeFormatFilter = $filter('timeFormatFilter');
step.time_modified = timeFormatFilter(step.time_modified);
</textarea>
| col 1 | col 2 |
|---|
1
2
3 | var timeFormatFilter = $filter('timeFormatFilter');
step.time_modified = timeFormatFilter(step.time_modified);
- In HTML
{{::Path.time_modified}}
6. Debounce ng-model
If you know there is going to be a lot of changes coming from an ng-model, you can de-bounce the input.
For example if you have a search input like Google, you can de-bounce it by setting the following ng-model option: ng-model-options="{ debounce: 250 }.
This will ensure that the digest cycle due to the changes in this input model will get triggered no more then once per 250ms .
https://docs.angularjs.org/api/ng/directive/ngModelOptions
7. Use ng-if instead of ng-show (but confirm that ng-if is actually better for your use case)
ng-show will render an element, and use display:none to hide it,
ng-if will actually removes the element from DOM, and will re-create it, if it’s needed.
You may need ng-show for an elements that toggles on an off often, but for 95% of the time, ng-if is a better way to go.
8. Use console.time to benchmark your functions
console.time is a great API, and I found it particularly helpful when debugging issues with Angular performance. I placed a number of those calls through out my code, to help me confirm that my re-factoring was in fact improving the performance.
https://developer.mozilla.org/en-US/docs/Web/API/Console/time
The API looks as such:
<textarea wrap="soft" class="crayon-plain print-no" data-settings="dblclick" readonly="" style="tab-size: 4; font-size: 14px !important; line-height: 20px !important; z-index: 0; opacity: 0; overflow: hidden;">console.time("TimerName");
//Some code
console.timeEnd("TimerName");
</textarea>
| col 1 | col 2 |
|---|
1
2
3
4 | console.time("TimerName");
//Some code
console.timeEnd("TimerName");
And here is a simple example:
<textarea wrap="soft" class="crayon-plain print-no" data-settings="dblclick" readonly="" style="tab-size: 4; font-size: 14px !important; line-height: 20px !important; z-index: 0; opacity: 0; overflow: hidden;">console.time("TimerName");
setTimeout(function(){
console.timeEnd("TimerName");
}, 100);
//In console $: TimerName: 100.324ms
</textarea>
| col 1 | col 2 |
|---|
1
2
3
4
5
6 | console.time("TimerName");
setTimeout(function(){
console.timeEnd("TimerName");
}, 100);
//In console $: TimerName: 100.324ms
Note: If console.time is not precise enough for your needs, you can get a more accurate reading using performance.now(). You will have to do your own math, if you choose to take this path.
https://docs.google.com/presentation/…
<textarea wrap="soft" class="crayon-plain print-no" data-settings="dblclick" readonly="" style="tab-size: 4; font-size: 14px !important; line-height: 20px !important; z-index: 0; opacity: 0; overflow: hidden;">totalTime = 0; count = 0;
var someFunction = function() {
var thisRunStartTime = performance.now();
count++;
// some code
// some more code
totalTime += performance.now() - thisRunStartTime;
};
console.log("Average time: " + totalTime/count);
</textarea>
| col 1 | col 2 |
|---|
1
2
3
4
5
6
7
8
9
10
11 | totalTime = 0; count = 0;
var someFunction = function() {
var thisRunStartTime = performance.now();
count++;
// some code
// some more code
totalTime += performance.now() - thisRunStartTime;
};
console.log("Average time: " + totalTime/count);
9. Use native JavaScript or Lodash for slow functions
Our app was already using lodash, so there was no overhead for me to use it in my optimization. If lodash was not include, I would probably try to re-write everything in native JavaScript.
In my tests I got a significant performance boost by simply re-writing some of the basic logic with lodash, instead of relying on built-in Angular methods (which have to account for much more generic use cases).
Maintainer of Lodash John-David Dalton is also a co-creator of https://jsperf.com/, and he is all about the performance. So I trust him and his library when it comes to speed.
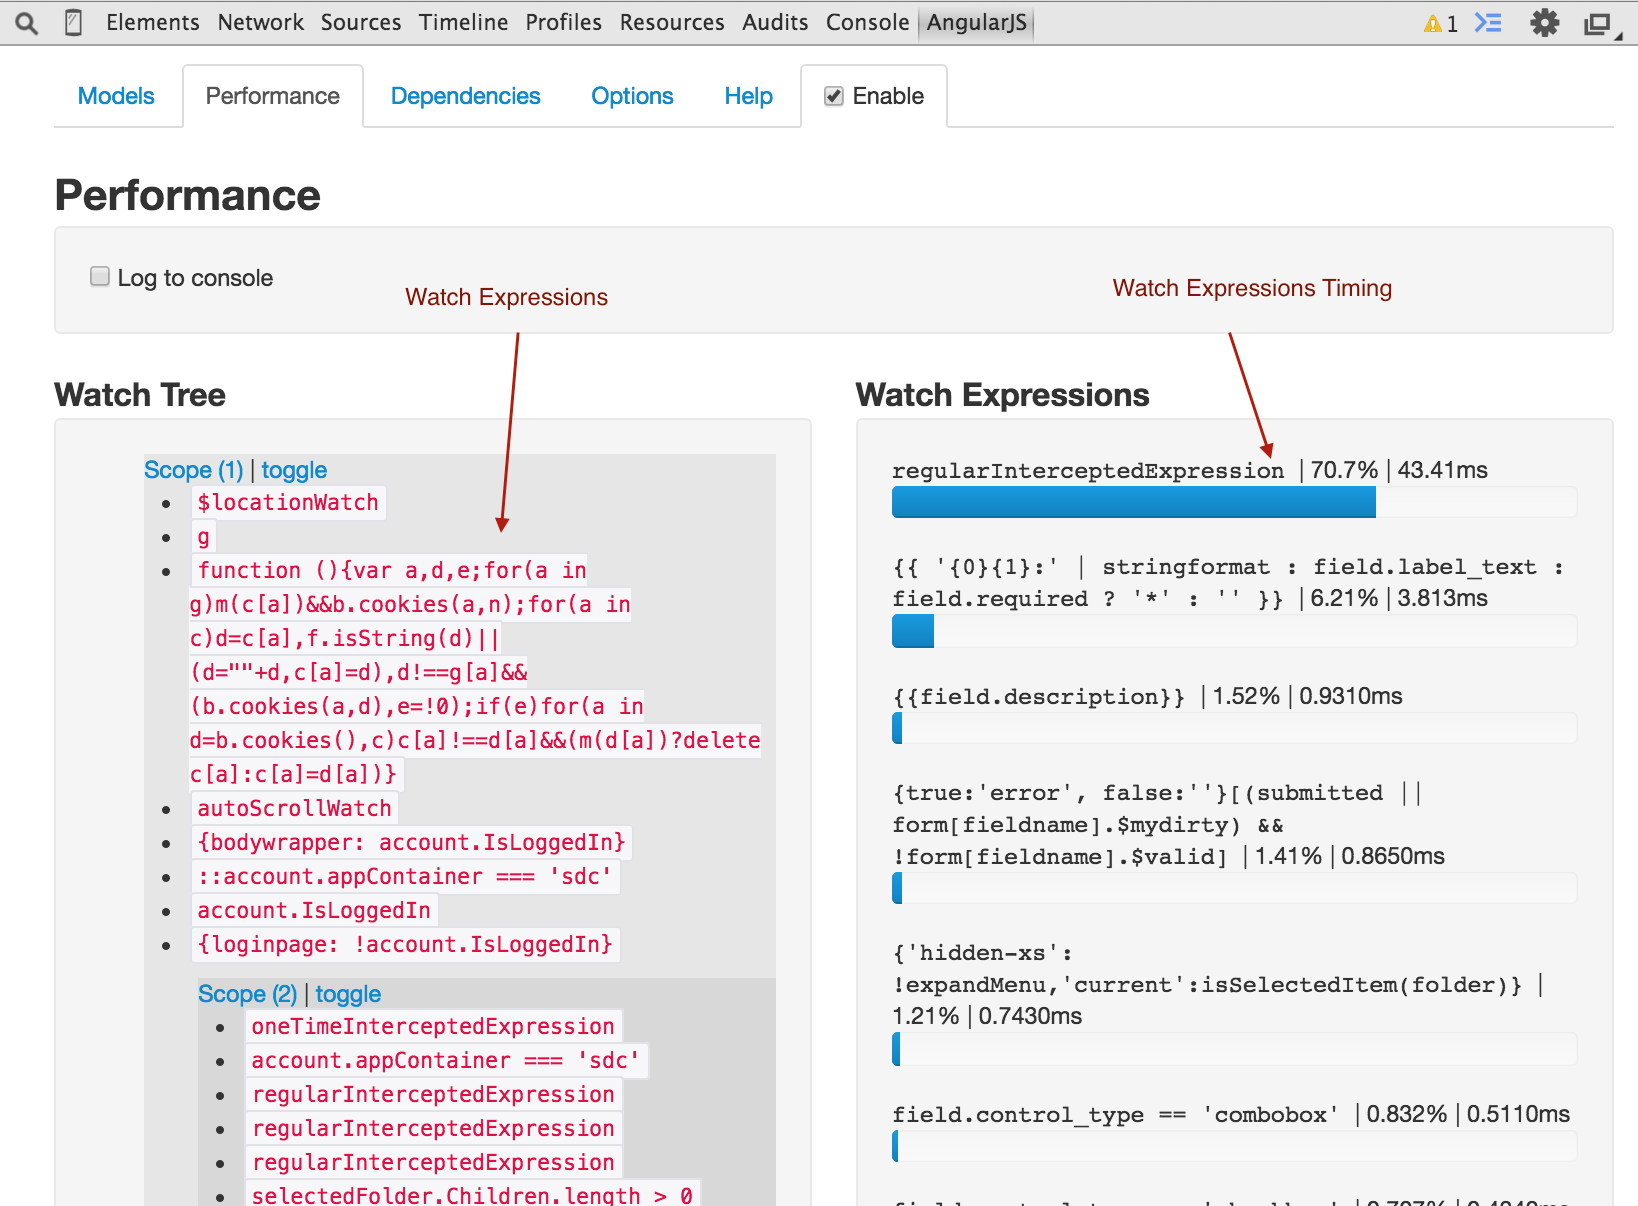
10. Use Batarang to benchmark your watchers
Batarang is a great tool from the Angular team, and it was very helpful in my debugging efforts. It has a lot of useful features, but the one that was the most relevant to this use-case is the performance tab.
Make sure to get the stable version, which seems to work for the majority of users.
https://chrome.google.com/webstore/detail/angularjs-batarang-stable/niopocochgahfkiccpjmmpchncjoapek
Watch this video to get more insight into the Batarang.
<iframe width="560" height="315" src="https://www.youtube.com/embed/q-7mhcHXSfM" frameborder="0" allowfullscreen=""></iframe>
11. Use Chrome Timeline and Profiler to identify performance bottlenecks
I like to think of myself as a Chrome Dev Tools power user. But it’s not often that I get a to use the Timeline and Profiler views. In this project, both were extremely helpful.
Pro Tip: If you use console.time API (see tip #8), the time period will get highlighted on your timeline snapshot. So you can examine the exact time period that you care about the most.
https://developer.chrome.com/devtools/docs/timeline#user-produced-timeline-events
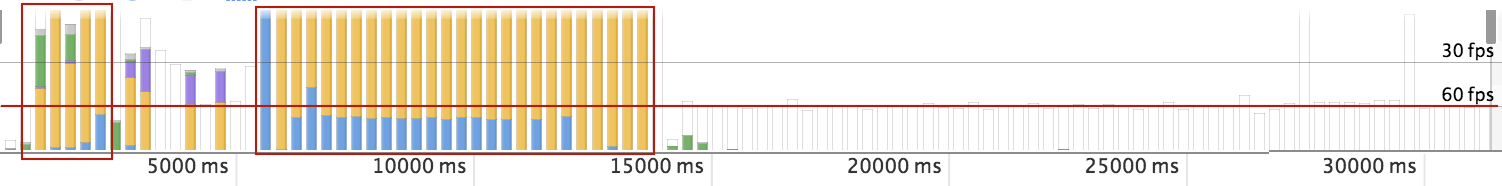
The timeline view, and the magic 60fps line is crucial. When I started on our project, the app was rendering full steam for 15 seconds or more, becoming almost completely unresponsive to the user.
After performance optimization, the app now fully renders in less then 2 seconds (note that the time scale is different), allowing users to freely interact with the user interface after a relatively short delay.
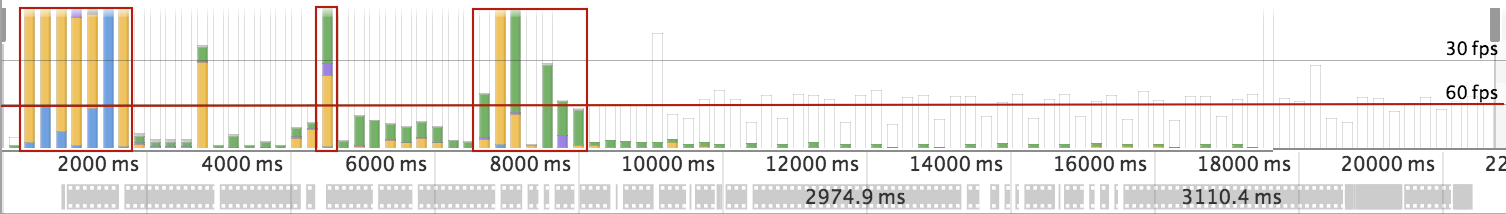
It is clear from looking at the image that the app could be further optimized. But even as is, I am very happy with the improvements to the user experience.
To get more experience with Timeline view, check out these web audits by Paul Irish:
https://docs.google.com/document/d/1K-mKOqiUiSjgZTEscBLjtjd6E67oiK8H2ztOiq5tigk/pub
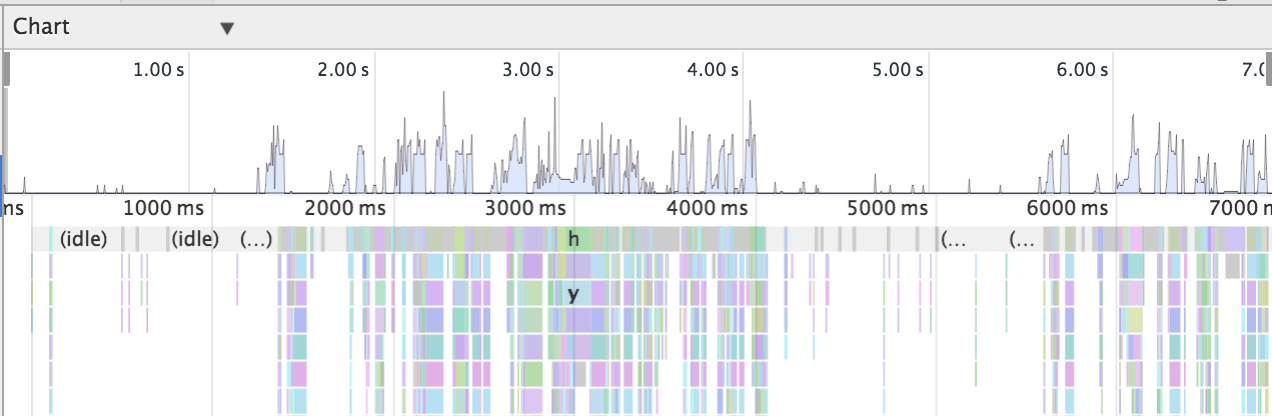
Finally, I wanted to mentioned the Profiling tab in Chrome Dev tools, and the JavaScript CPU profiler in particular. It has 3 views:
1. Chart view is similar to the timeline, but it makes it a bit easier to jump to the source code of the function of interest.
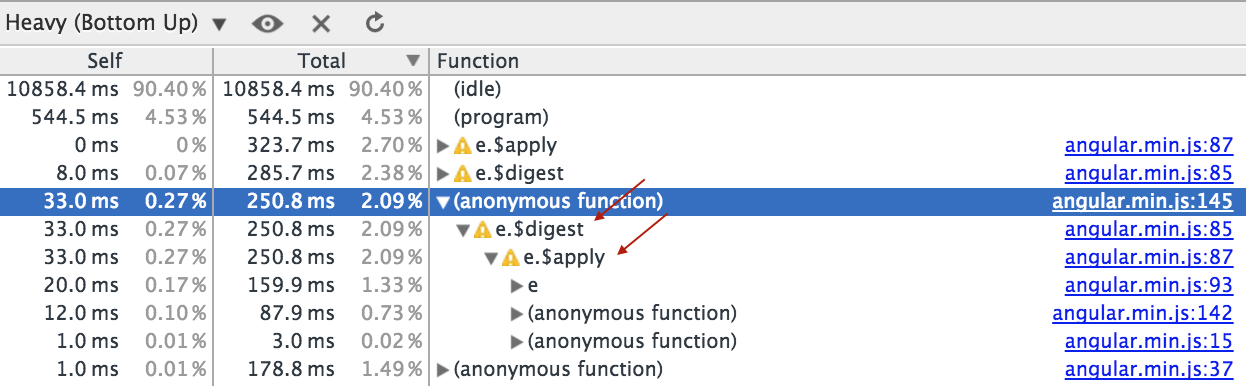
2. Heavy (Bottom up view)
This view identifies heavy user functions, and shows you the reverse call stack to help pinpoint origination of the function. Note how $digest comes before the $apply, indicating the reverse order.
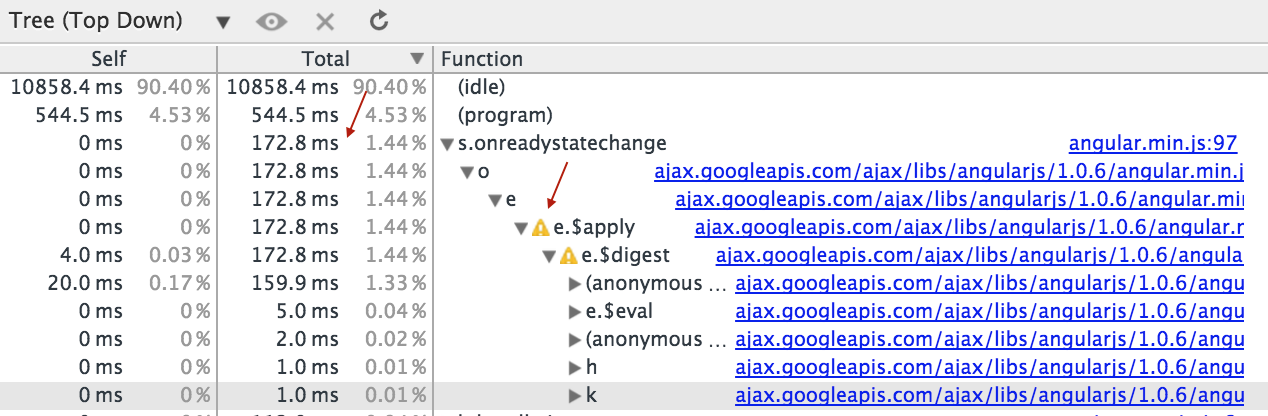
3. Tree (Top Down)
Exposes the functions from which the heavy consumption originated, and then you can drill down to find the offending function.
Also note the yellow triangle with a “!”, if you however over it, it will identify a potential optimization problem.
https://developer.chrome.com/devtools/docs/cpu-profiling
P.S. If you found these tips helpful, please consider reviewing this post on Amazon
